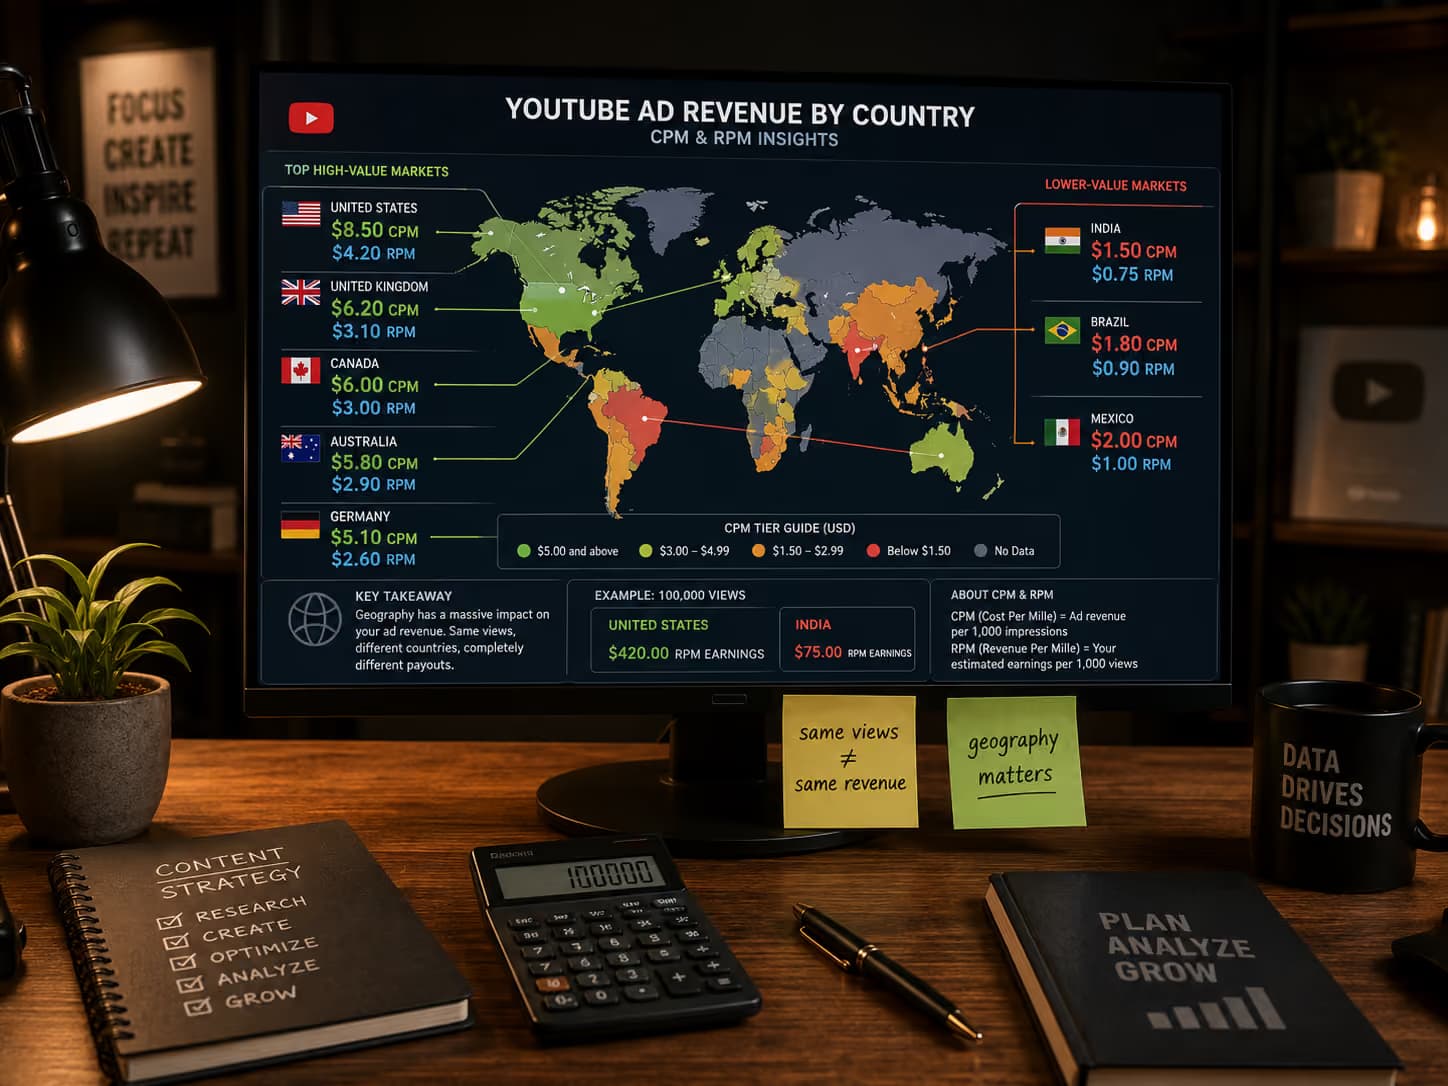
The same YouTube views pay several times more in the United States than in India. In 2026, a US audience averages about $8.50 CPM and $4.20 RPM. India often sits near $1.50 CPM and $0.75 RPM.
| Country | Average CPM | Average RPM | | --- | --- | --- | | United States | ~$8.50 | ~$4.20 | | United Kingdom, Canada, Australia, Germany | $5–$6.50 | — | | Japan, South Korea, Italy, Spain, France | Mid-tier | — | | Brazil and Mexico | Lower | — | | India | ~$1.50 | ~$0.75 |
That gap isn’t random—it’s driven by advertiser demand, purchasing power, and audience location. For creators (and the brands or rights holders who work with them), geography is one of the most powerful—and often overlooked—levers on YouTube revenue.
Why Country Changes Everything
Advertisers pay more to reach viewers in markets with higher purchasing power and stronger demand. The result is wide variation in CPM (what advertisers pay per 1,000 monetized impressions) and the RPM creators actually take home after YouTube’s cut and other factors. The US figure is strongest in Finance and Business. Brazil and Mexico pay less per view, but the volume can still matter.
A channel whose audience is heavily skewed toward lower-CPM countries will see its blended RPM pulled down even if total views look healthy. The reverse is also true: shifting even a portion of views toward higher-value geographies can lift overall earnings without changing the core content format.
CPM and RPM are not the same thing. CPM reflects the advertiser side. RPM is closer to what the creator actually receives and can include ads, Premium, memberships, Super Chat, and other sources. Country tables are useful directional signals, not guarantees. Your own YouTube Studio geography and revenue reports are the only numbers that matter for decisions.
Attribution Gets More Complex Once Assets Cross Borders
For partners and content owners using Content ID or managing rights across markets, the picture is even more layered. YouTube is monetized in over 85 markets, and ownership, fair-use definitions, and monetization policies can differ by territory.
Revenue isn’t always straightforward:
- Different owners may control the same asset in different countries.
- A single user video can receive multiple valid claims (common with mashups). In multi-claim cases YouTube applies the most restrictive policy across the overlapping territories.
- Revenue is generally split according to active monetized claims and ownership percentages by territory.
- Estimated figures in Analytics arrive with a delay; finalized numbers appear later in downloadable Ads Partner Revenue reports (Asset, Video, and Claims reports).
Partners who want accurate country-level performance need both the Analytics territory breakdowns and the downloadable Asset reports filtered by country. Without rigorous tracking, revenue can be under-claimed, delayed by ownership conflicts, or lost to mismatched policies.
Custom policies, match conditions (length or percentage of match), and campaigns that redirect viewers from claimed UGC back to official content become practical tools for protecting and growing revenue across borders.

Practical Ways to Take Control
Audit your current geography. In YouTube Studio, pull the last 28 days of audience data. Identify your top countries by views and compare them against known CPM ranges. If a large share of views sits in sub-$3 CPM markets, note it.
Match topic + geography. High-CPM countries respond better to certain niches (finance, tech, business). Test content angles that already perform well for your highest-value viewers rather than chasing geography in isolation. Retention still matters—shifting audience without watch time is counterproductive.
Track real performance, not averages. Compare your highest-RPM videos against highest-CPM videos. Look for overlapping patterns in topic, format, or traffic source, then test those on the next uploads. Tools that surface authenticated revenue by video and geography make this faster.
For rights holders and multi-territory owners: Keep reference files current, set clear match policies by territory, monitor ownership conflicts, and review multi-claim scenarios. Use Asset reports to allocate revenue accurately for payouts. Campaigns that point claimed user videos back to official content can recover additional value.
Think beyond a single platform. Traditional ad systems reward certain geographies heavily. Performance-based platforms that pay on validated views or clicks (with transparent fees and no follower minimums) give creators another way to monetize real engagement regardless of where the traditional advertiser dollars concentrate.
The Bottom Line
Country demographics quietly shape what your content is worth because advertisers value different audiences differently. The creators and partners who treat geography as a measurable variable—pairing it with niche, retention, accurate attribution, and smart policy settings—earn more from the same creative effort.
Open your analytics, look at where your viewers actually live, and start testing. The difference between average and optimized revenue often starts with that single report.
Exploring tools that reward validated attention—such as those available through Wayo Ads—can sit alongside that geography work.
Sources
- Exploring Factors Influencing YouTube Earnings (ResearchGate)
- Attribute YouTube Revenue to Assets by Country (Global Social Media Marketing)
- YouTube CPM by Country (TubeAnalytics)
Source & Resources
Official documentation, research, and high-authority sources: